Simple Python Profiling with IPython
Profiling is imperative to understand your application. However, getting started with profiling might seem to be a steep learning curve; but it doesn't have to be! IPython has a lot of built-in magic commands, and some of them are helpful to profile your Python code. %timeit and %prun are among the ones I found most useful.
%timeit
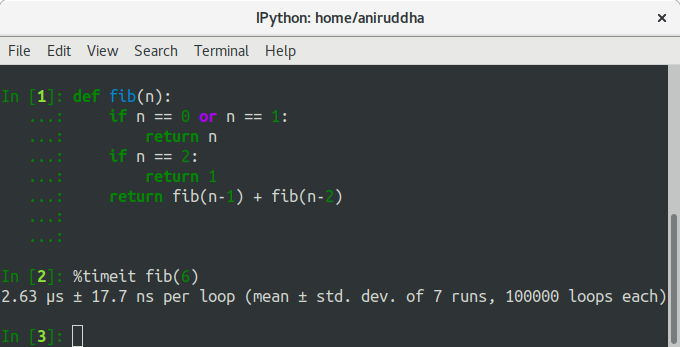
%timeit does exactly what it sounds like. It times your function. It niftily (is that a word?) providers the standard deviation of multiple runs as well. So essentially you probably won't get lucky by chance performance reports.
%prun
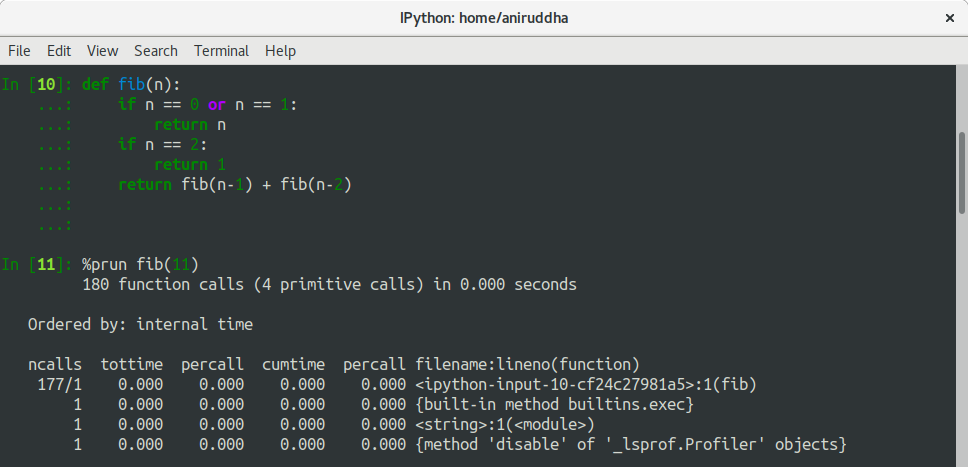
This is a rather comprehensive profiling. You can check the functions of being called, the number of times they're called, and so on. This is especially useful while writing something recursive or with a deep call stack.
If you are using third-party plugins or modules, often it is difficult to pinpoint the performance issue - in your code or in their code? %prun will help by inspecting the entire call stack.
Of course, while writing recursive functions, you can actually visualize how your number of calls grow out of proportions as the problem size increases!
Cheers!