Viewing OpenCV matrices with matplotlib (w/ Jupyter Notebook)
While working with OpenCV, constantly popping up a new Window to view the results might not be the most effective way of work. However, we can minimize the burden if we are working on Jupyter Notebook; with matplotlib. Essentially we plot the matrices with matplotlib.pyplot.imshow.
Opening an image
It's pretty straightforward as you may have been used to, before.
import numpy as np
import cv2

img = cv2.imread('butterfly.jpg')
Viewing with Matplotlib
Now comes the fun part, we will use the normal imshow function from matplotlib.pyplot.
from matplotlib import pyplot as plt

plt.imshow(img)
Unfortunately, you will be presented with a BGR image (Blue, Green, Red). Your colors will shift! Let's take a look at an example.
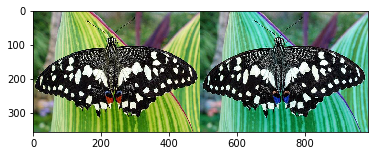
The image on the left is an RGB image (the original one), and on the right - the image is read on the BGR colorspace; the red and blue channels swapped. A quick fix is to convert the color channel before viewing the image.
rgb_img = cv2.cvtColor(img, cv2.COLOR_RGB2BGR)
plt.imshow(rgb_img)
Channels beyond RGB
You can actually pick which color channel to use while "plotting" an image with imshow. Let's see that in action. We are converting our image to the Grayscale colorspace. But the output is not so gray (or so as it seems?)
gray = cv2.cvtColor(img, cv2.COLOR_RGB2GRAY)
plt.imshow(gray)
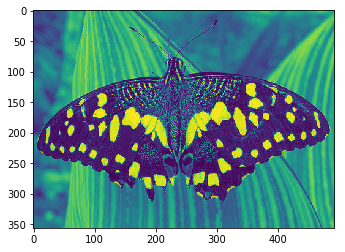
The image looks quite greenish. The fix is to properly assert the color channel while plotting.
plt.imshow(gray, cmap='gray')
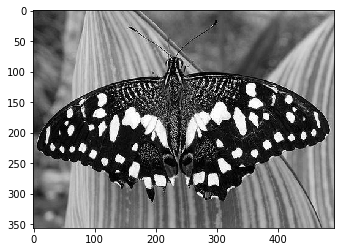
And that fixes the problem. Hope this brief post helps! Thanks for reading :)